The volume from which this wall chart imaged is formally titled (in the Victorian style): Deacon's synchronological chart, pictorial and descriptive, of universal history : with maps of the world's great empires and a complete geological diagram of the earth.
The title plate indicates the "Maps, etc" were "drawn by Professor Edward Hull."
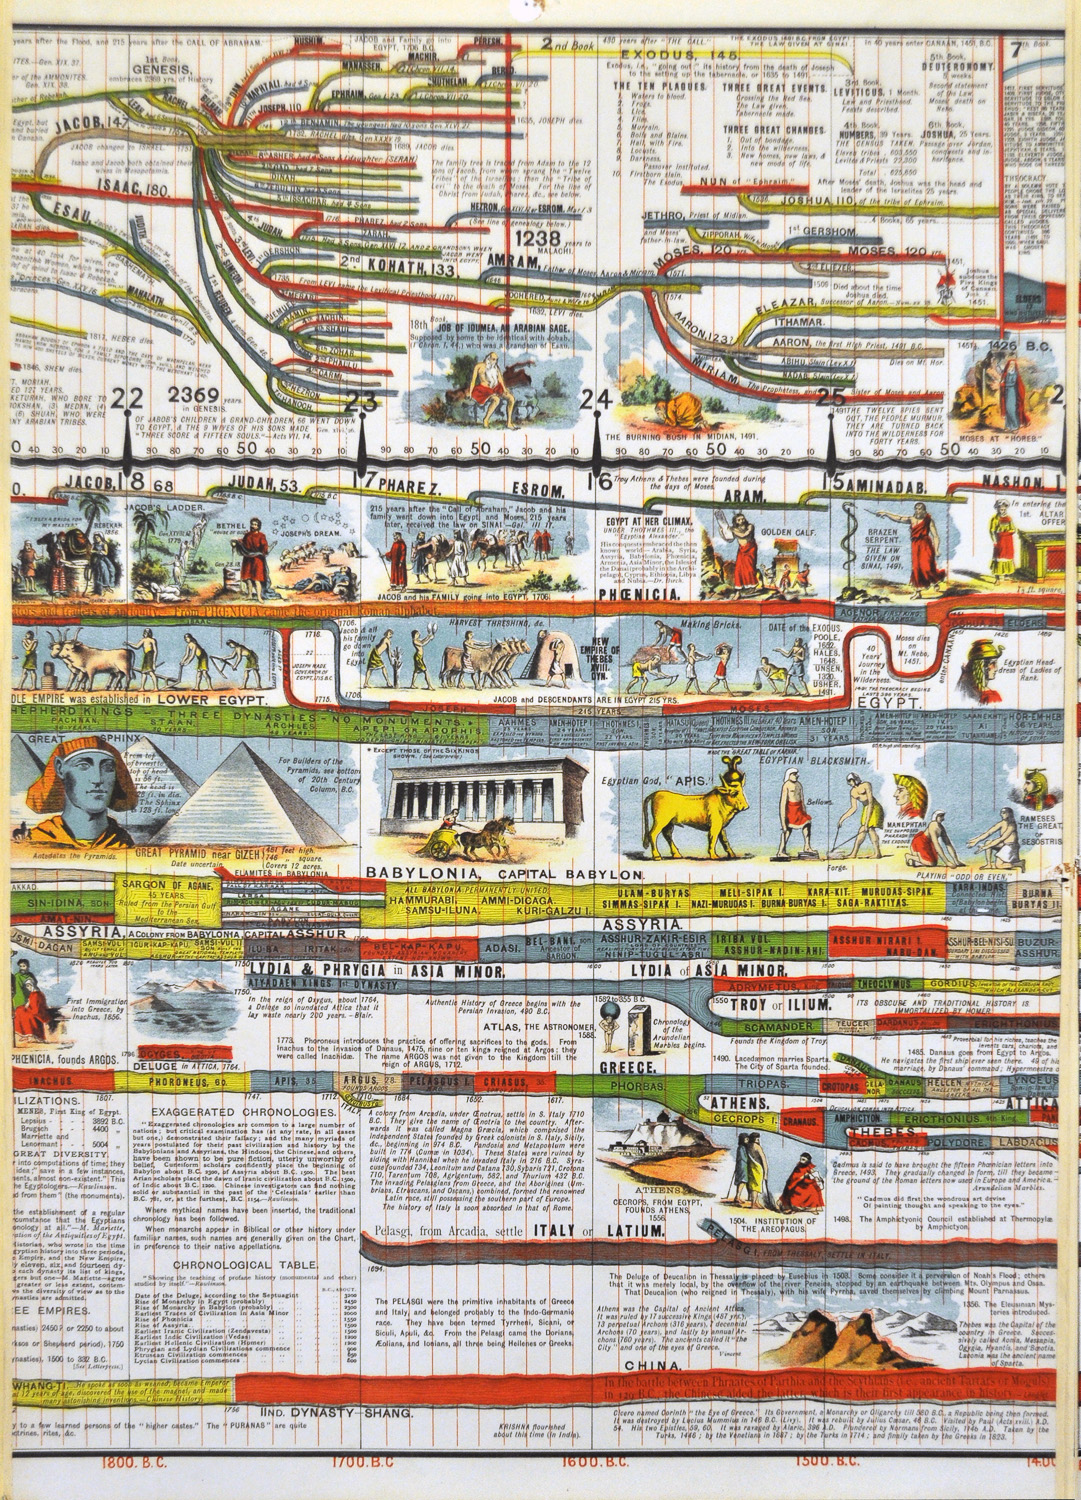
Originally the famous 23-foot chart of "Universal History" was both imagined and drawn by Sebastian C. Adams, a Presbyterian missionary. He published it in many forms over a period of years, with the first edition of the Chart being published in 1877.
After Adams' death, several updates were published to include more recent historical events and people. The volume from which we have imaged the published chart represents one of these later revisions of the Chart. In this particular publication, Professor Edward Hull is credited with drawing a "Complete Geological Diagram of the Earth," but the centerpiece remains the fabulous Timeline created by Adams.
- DA
![]()
Come to the CSUEB Hayward Campus' Library and view this 23-foot visual marvel, originally published in 1877.
The "chart" - what we today would term a "timeline" - traces human history from a specific date in 4,000 B.C. as determined by Biblical scholars of the time, and attempts to unravel the complex threads of the Old and New Testaments, before merging into a secular record of various world empires and leaders, right down to U.S. President Garfield in 1877!
The chart is compelling visually, as well as for the mind-set and underlying cultural assumptions it betrays in a critical period in world history, characterized by Imperialism and Industrialization.
Producer: Richard Apple
Concept and Content Development: Linda Dobb, Richard Apple
Text, Poster and Graphic Design: Richard Apple
Archival Support: CSUEB Special Collections
Copyright 2010-2015 by the CSUEB University Libraries

The original Synchronological Chart created by Sebastian C. Adams extends over 23 feet in length, and should ideally be viewed mounted on a wall, so that one can walk the length of the work and appreciate the colorful, intricate detail as it contributes to the entire historical context presented.
For purposes of the CSUEB exhibit, a fold-out chart from one of our books in Special Collections was photographed in sections, married together in Photoshop, then printed on a large-scale printer. The chart was then mounted on sections of foam core and hung in the Library's Upper Mall, coming in roughly at 34 feet in length.
During the 60 months it was on display, beginning in 2010, it was a popular draw; almost any given day we could count on at least a few new people perusing the chart, and would also expect a half dozen "repeat" viewers!


You have two options: